Tutorial
This tutorial walks through the main features available in pinout. If you have not installed pinout already please read the Install and Quickstart section. This tutorial duplicates code from pinout_diagram.py. To access a copy of this file and other resources required to complete this tutorial see Quickstart.
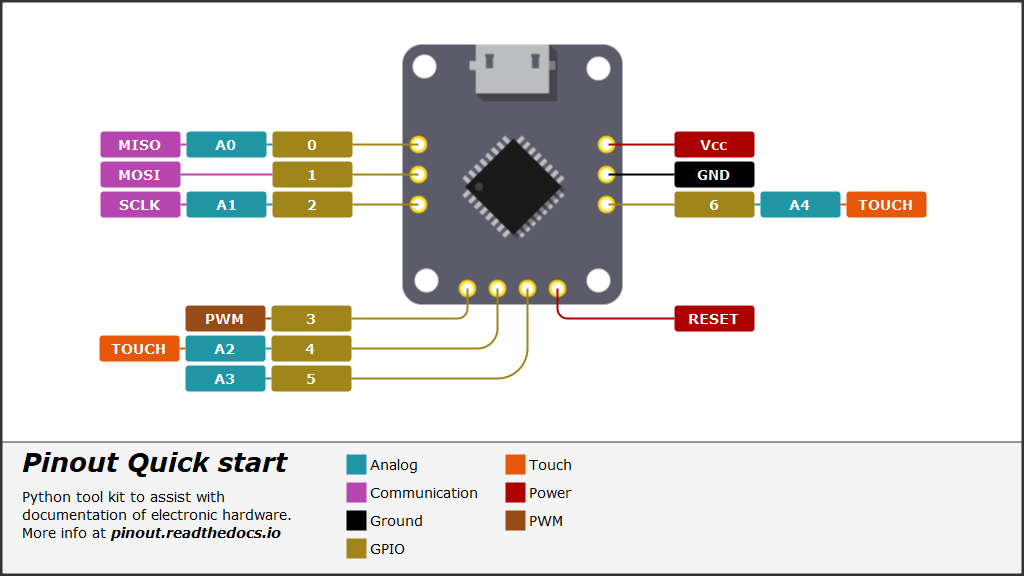
The finished diagram from this tutorial.
Import modules
Start by importing pinout modules required to create the sample diagram. For this tutorial the diagram data has been stored in a separate file which is also imported here:
from pinout.core import Group, Image
from pinout.components.layout import Diagram_2Rows
from pinout.components.pinlabel import PinLabelGroup, PinLabel
from pinout.components.text import TextBlock
from pinout.components import leaderline as lline
from pinout.components.legend import Legend

# Import data for the diagram
import data
Diagram setup
The Diagram_2Rows class creates a blank diagram instance featuring two panels to hold further components and make up the pinout diagram. The instance is named ‘diagram’ here as this is the default instance name pinout.manager looks for when exporting the final graphic. Presentation styles are controlled via a cascading style-sheet, also added to the diagram here:
# Create a new diagram
# The Diagram_2Rows class provides 2 panels,
# 'panel_01' and 'panel_02', to insert components into.
diagram = Diagram_2Rows(1024, 576, 440, "diagram")

# Add a stylesheet
diagram.add_stylesheet("styles.css", embed=True)
Components can be grouped independently from a panel. This aids with fine-tuning of a layout as a group of components can be moved as a single unit:
# Create a group to hold the actual diagram components.
graphic = diagram.panel_01.add(Group(400, 42))
Hardware image
An image that requires pinout information is obviously required and added with the Image class. Width and height arguments are optional. If omitted the pixel dimensions are automatically detected and used. ‘x’ and ‘y’ attributes can also be supplied to position the top-left of the image to more suitable coordinates:
# Add and embed an image
hardware = graphic.add(Image("hardware.png", embed=True))
Measuring up
Key coordinates on the image need to be documented for related components to align correctly. It is a good idea to undertake measuring as a distinct step and usually quicker than estimating with trial-and-error later on. Measurements are pixel dimensions from the top, left corner (with an exception - see following note on ‘pin pitch’) :
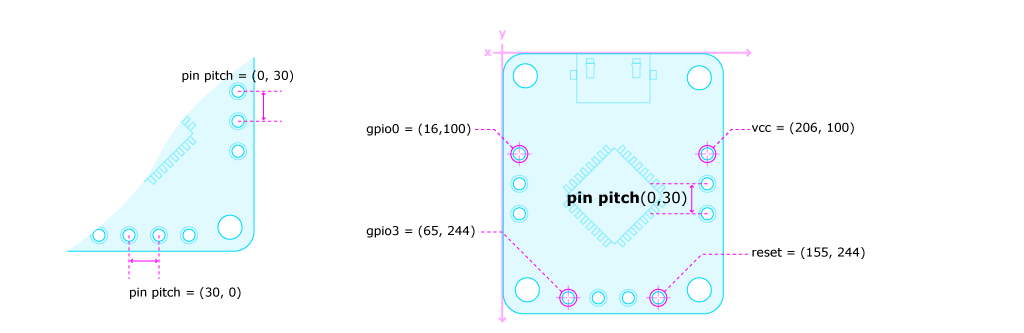
These coordinates could be used ‘as is’ later on but recording them with the Image class provides a clear association plus coordinates are transformed automatically to remain correctly positioned if the image’s x, y, width, or height are adjusted:
# Measure and record key location with the hardware Image instance
hardware.add_coord("gpio0", 16, 100)
hardware.add_coord("gpio3", 65, 244)
hardware.add_coord("reset", 155, 244)
hardware.add_coord("vcc", 206, 100)
# Other (x,y) pairs can also be stored here
hardware.add_coord("pin_pitch_v", 0, 30)
hardware.add_coord("pin_pitch_h", 30, 0)
Note
Arbitary (x,y) data can also be recorded with the image. The pin-header pitch has been recorded in this manner. Transformed values can then be automatically calculated if the image’s width or height are altered.
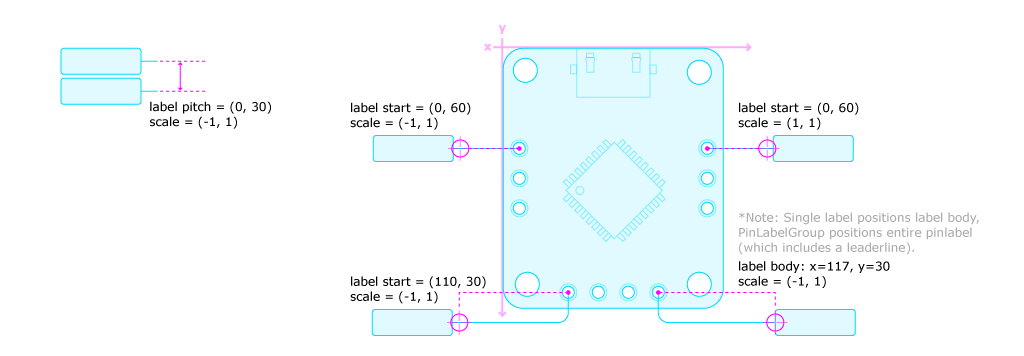
pinout provides great flexibility when positioning pin-labels. Key details to note:
‘x’ and ‘y’ values are relative to hardware coordinates.
label_pitch is an (x,y) offset between each pin-label in a PinLabelGroup
scale is used to ‘flip’ labels. Negative values may yield unexpected results
‘x’ and ‘y’ positions the entire label or row component, including a leaderline. A pin-label’s body can be positioned in addition to the component positioning.
Add a single pin-label
In some instances adding pins individually might be appropriate. This pin is being added to the ‘graphic’ group - the same component that the image is in - and references coordinates filed with the image. Also demonstrated on this pin are some customisations of the pin-label’s body and leaderline:
# Create a single pin label
graphic.add(
    PinLabel(
        content="RESET",
        x=hardware.coord("reset").x,
        y=hardware.coord("reset").y,
        tag="pwr",
        body={"x": 117, "y": 30},
        leaderline={"direction": "vh"},
    )
)
Add Multiple pin-labels
Where pins are arranged in ‘headers’ (a line of evenly spaced pins) the PinLabelGroup class can be used to automate many of the geometry calculations required to place individual pin-labels.
x, y: Coordinates of the first pin in the header.
pin_pitch: Distance between each pin of the header. (0, 30) steps 0px right and 30px down for each pin. TIP: (30, 0) creates a horizontal header.
label_start: Offset of the first label from the first pin, note that negative x values here may produce unexpected results. pin-label groups should be flipped with scale instead (more explaination later).
label_pitch: Distance between each row of labels.
labels: Label data. See data.py for examples
# Create pinlabels on the right header
graphic.add(
    PinLabelGroup(
        x=hardware.coord("vcc").x,
        y=hardware.coord("vcc").y,
        pin_pitch=(0, 30),
        label_start=(60, 0),
        label_pitch=(0, 0),
        labels=data.right_header,
    )
)
Pin-label orientation
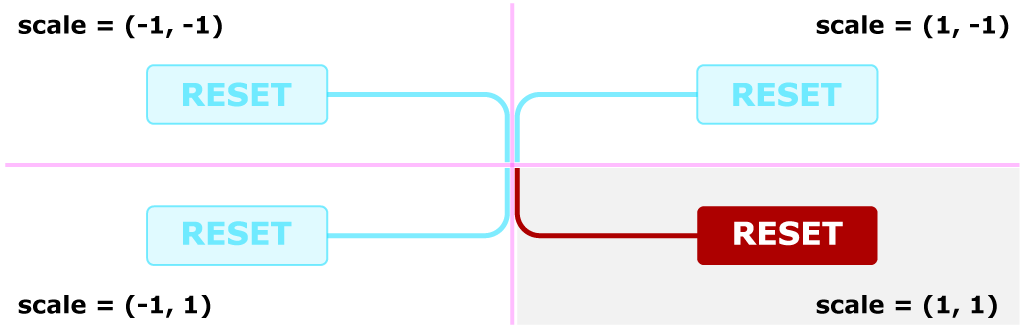
SVG format allows ‘flipping’ or ‘mirroring’ elements by scaling them with a negative value eg. scale=(-1, 1) flips a component around a vertical axis. _pinout_ makes use of this feature, a scale attribute can be supplied to components to flip their layout. This can take some getting use to but provides a concise method of control. The following pin-label groups are scaled to orient in the opposite direction.
# Create pinlabels on the left header
graphic.add(
    PinLabelGroup(
        x=hardware.coord("gpio0").x,
        y=hardware.coord("gpio0").y,
        pin_pitch=(0, 30),
        label_start=(60, 0),
        label_pitch=(0, 0),
        scale=(-1, 1),
        labels=data.left_header,
    )
)

# Create pinlabels on the lower header
graphic.add(
    PinLabelGroup(
        x=hardware.coord("gpio3").x,
        y=hardware.coord("gpio3").y,
        scale=(-1, 1),
        pin_pitch=(30, 0),
        label_start=(110, 30),
        label_pitch=(30, 30),
        labels=data.lower_header,
        leaderline=lline.Curved(direction="vh"),
    )
)
Title block
Adding a title and supporting notes can help readers quickly place a diagram in context and summarise important points:
# Create a title and a text-block
title_block = diagram.panel_02.add(
    TextBlock(
        data.title,
        x=20,
        y=30,
        line_height=18,
        tag="panel title_block",
    )
)
diagram.panel_02.add(
    TextBlock(
        data.description.split("\n"),
        x=20,
        y=60,
        width=title_block.width,
        height=diagram.panel_02.height - title_block.height,
        line_height=18,
        tag="panel text_block",
    )
)
Legend
Adding a legend is easy as a dedicated component exists in _pinout_. The component flows into multiple columns if a ‘max_height’ is supplied:
# Create a legend
legend = diagram.panel_02.add(
    Legend(
        data.legend,
        x=340,
        y=8,
        max_height=132,
    )
)
Export the diagram
With all the required files present, the diagram can be exported via command-line:
py -m pinout.manager --export pinout_diagram.py diagram.svg

# expected output:
# > 'diagram.svg' exported successfully.
The exported file is SVG format. When viewed in a web browser it should match the finished diagram shown here. This format is excellent for high quality printing but still an effecient size for web-based usage.
The finished diagram from this tutorial.
Next steps
This guide has glossed over many features, attribute, and configurations available. Experimenting with changing values and re-exporting the diagram will quickly reveal their purpose. All function are documented in the Modules section.
Depending on you intended usage, linking (instead of embedding) the image might be desirable. Set embed=False when adding an image to achieve this outcome. Note: When linking, URLs are relative to the exported diagram file. When embedding these URLs are relative to the current working directory (the directory you run the script from).
TIP: Embedding the image and stylesheet allows the SVG display correctly in InkScape. This might be an appealing work-flow option for encorporating the diagram into other media or exporting in alternative formats.
More feature-rich examples are available in the samples folder of the pinout github repository.